- Bitcoin and Macro Finance Trading
- Posts
- Bitcoin and Finance Charts, Trading, Investing - 7/28
Bitcoin and Finance Charts, Trading, Investing - 7/28
A cut cuts both ways, AI Bubble rages, Bitcoin in a box . . . . . . again . . . . . . . . isolating more targets

This Is Not Investment Advice
Assessing the AI Bubble as Powell Stares Down Legacy
Just how big is this AI bubble? Does it matter? My senses continue to send me in a direction of where one’s ability to feel comfortable being uncomfortable might produce the best results. The QQQ and Spyder just simply won’t go down if we are to look strictly at the last several weeks and since the April bounce. We all know this is not sustainable into perpetuity, but are you ready to step in front of this freight train?
ZeroHedge.com published an excellent piece analyzing research from Morgan Stanley recently.
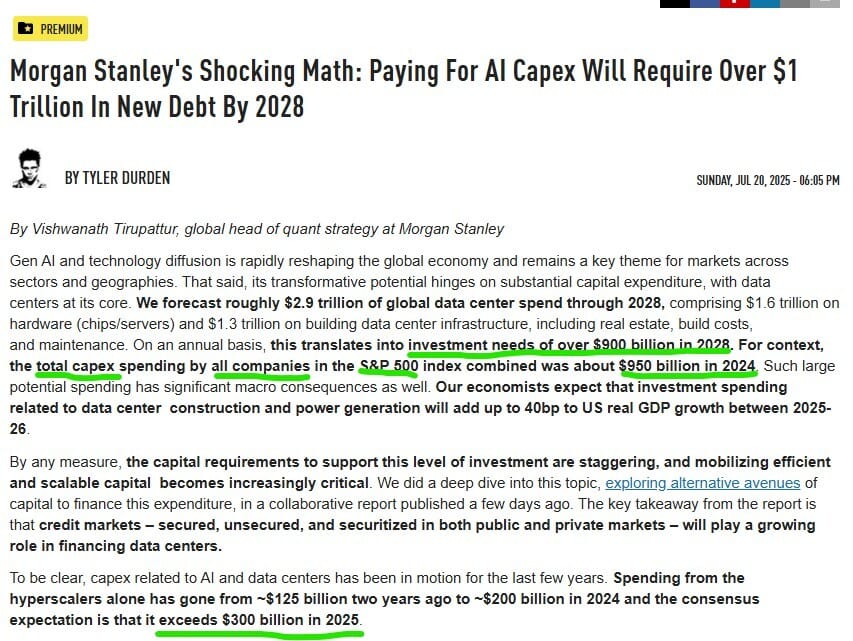
The precise numbers are not what matters to me, and I don’t care about critiquing Morgan Stanley if these numbers do not end up being accurate. Focus on the bigger picture. AI CAPEX for 2025 is projected to be about $300B. MS says this will vault to about $900B in 2028. That’s only a couple years away and they expect it to triple between now and then. That amount would essentially match what the entire Spyder spends on total CAPEX currently.
This is explosive growth that impacts a handful of key sectors that we can track via the IBD Industry Group Rankings. I’m not ruling out a protracted surge in certain groups and equities (and Bitcoin) that eventually crumbles when it gets too far ahead of itself only to pick back up and resume. The market can and will sniff out this explosive growth.
Rates and the Yield Curve . . . . . . . . . my senses are suggesting we are approaching a “heads you lose, tails you lose” scenario for credit. The ‘Big Beautiful Bill’ is now law, and Trump owns it. Guess what? If the bill delivers as promised and growth surges . . . . . . . that is upwards pressure on longer duration from higher growth and inflation expectations. If the economy does not grow in line with the needs of Option B and the ‘Melt Up’ . . . . . . . . . . . then Bessent and Trump are holding the bag while longer duration gets hit sending yields even higher given the mountain of debt created by Option B. If we don’t get the growth Option B needs the market will punish long duration for adding even more credit risk and sovereign risk in exchange for paltry growth relative to the spend. Are you seeing where I am going with this?
Furthermore - should there be a cut to the FFR and/or JPow suggesting they are on the way, I personally find it entirely plausible that longer duration will decline if not plummet. Financial conditions are loose, real yields in Japan are still clearly negative (Yen Carry still on), assets are at all time highs, yields globally on the long end continue to grind higher, confidence is returning and enthusiasm for AI/Bitcoin and many other facets of the economy, and animal spirits are roaring in some senses. Correct - not a typo. Fed cuts to the FFR could (and likely will in my view) send LT yields considerably higher given the current environment.
However - at some point the Net Interest Expense moves from Financial Security and Economic Security to National Security. Is this the Fed Meeting where Powell starts guiding us more towards cuts? Time will tell. I’m nibbling TBT as a hedge against very strong Risk On gains this year thus far.
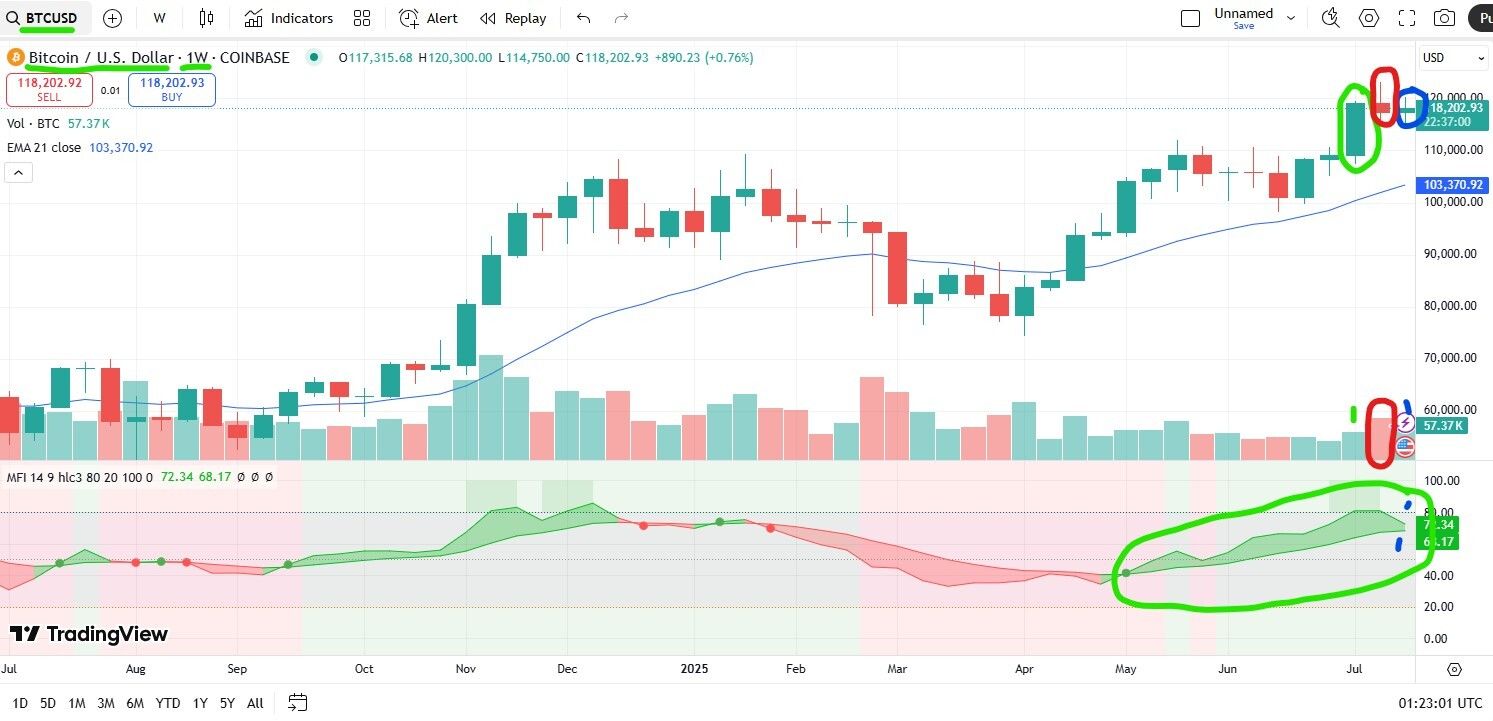
Bitcoin Weekly
The weekly chart, though still bullish overall on this time frame, is looking less bullish.
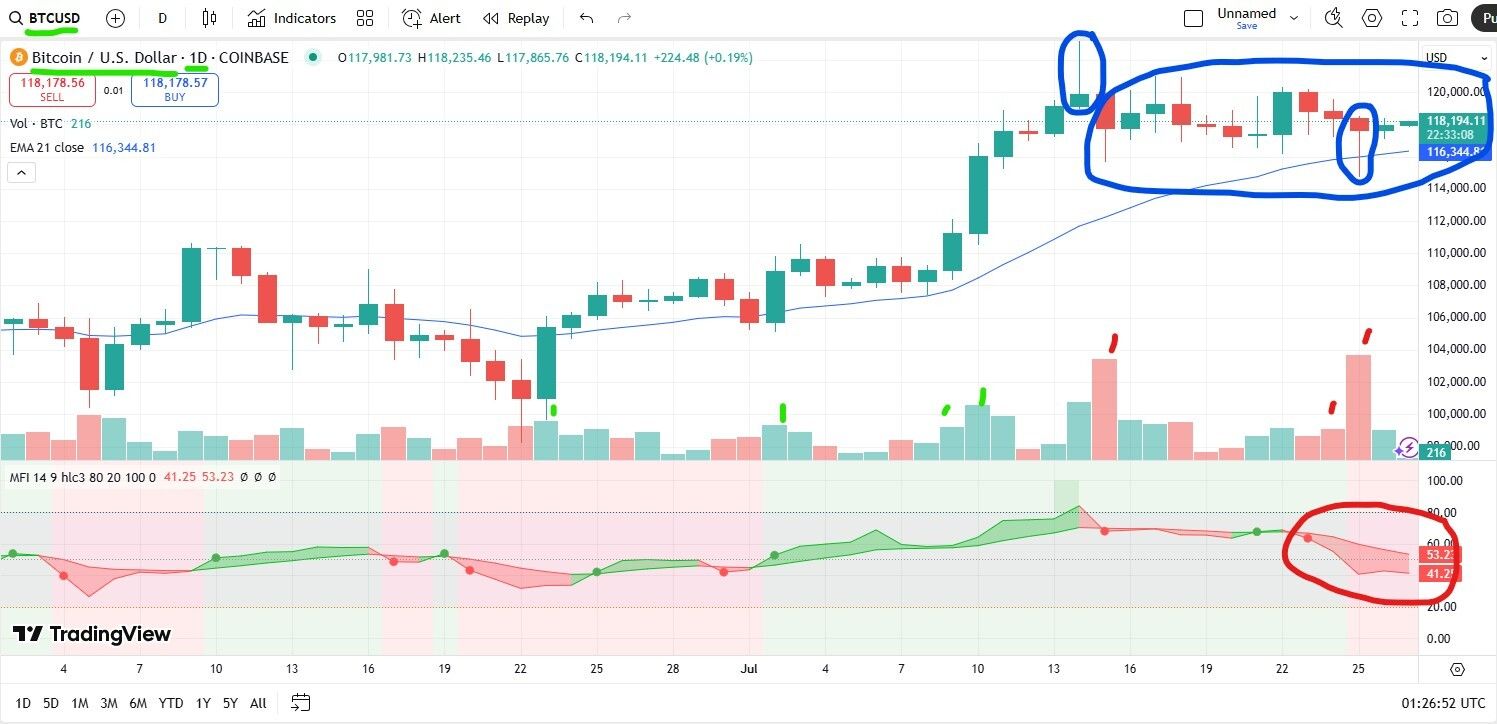
Bitcoin Daily
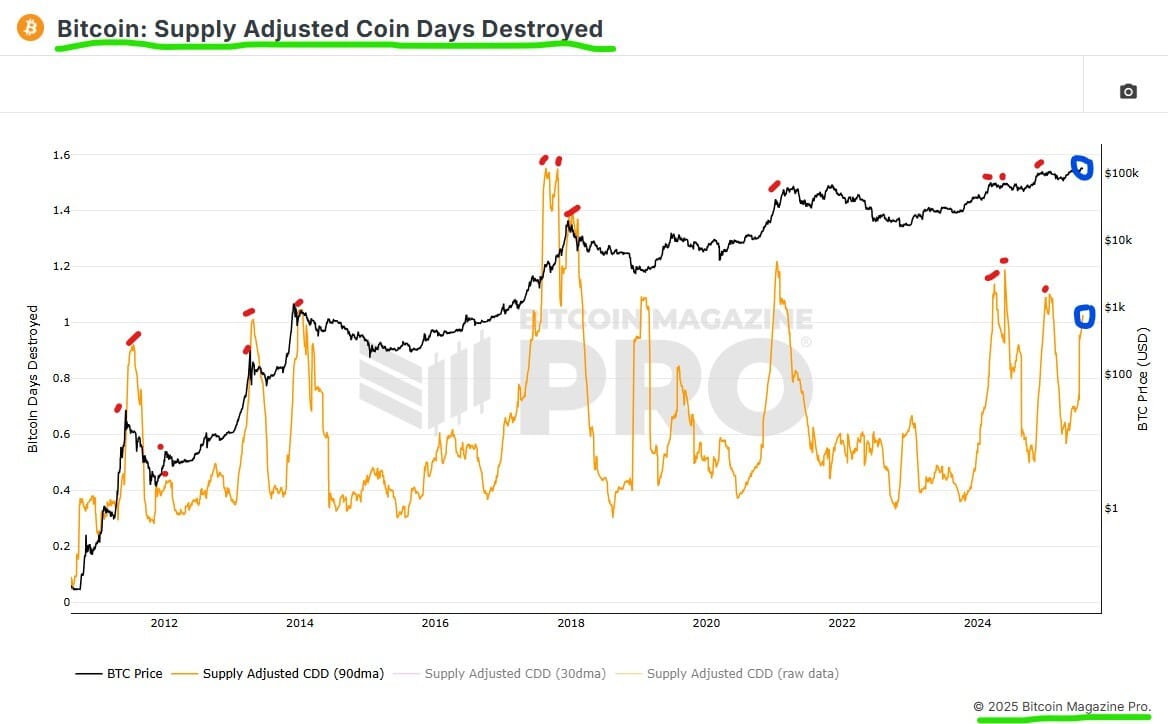
This data below, provided by BitcoinMagazinePro.com, is particularly pertinent in the current situation in my humble view. We are looking at the relative amount of coins sold by long term holders over time . . . . . . . . . . . . . . . among other things a look at how much growth in sold coins from long term holders occurred in the context of what the holders were feeling and experiencing at the time. Note - there appears to be fairly solid correlation here with local and cyclical tops and this metric rising, particularly above 1.00.
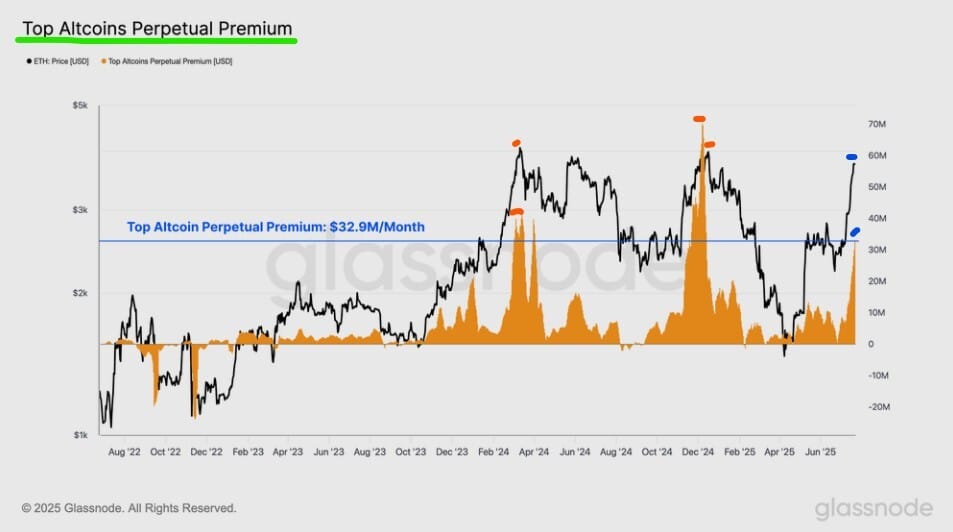
One might claim, perhaps accurately, that recent liveliness from “Altcoins” is taking away Money Flow from Bitcoin as it levitates inside a new Volume Profile. Perhaps that is true, but how much extra juice is the market already pumping into Ether in an attempt to muscle or force an ‘Alt Season’. The risk here, in my view, is Bitcoin breaking below its current Volume Profile AND this juiced up ‘Alt Season’ falling apart all at the same time.
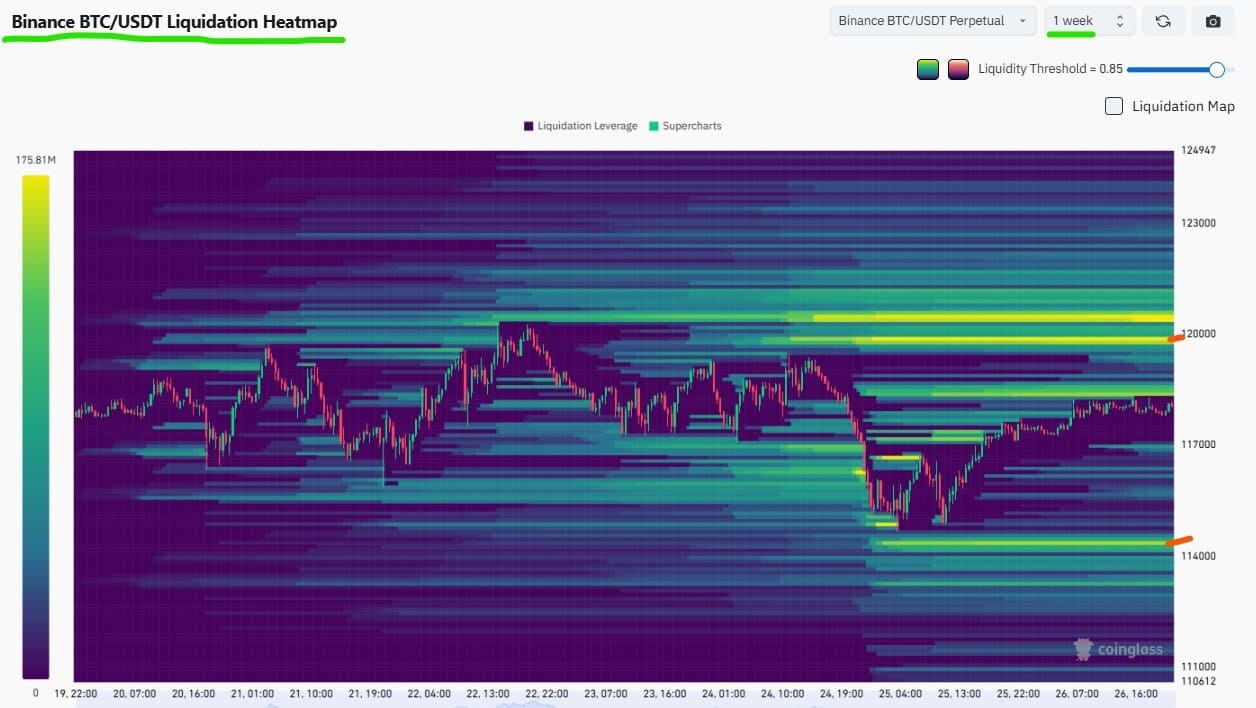
Liquidation Heat Map - One Week Time Frame
Bitcoin Bottom Line:
Let the market tell/show us what is next
As stated multiple times previously . . . . . . . . . . the longer Bitcoin trades within a new range or box (like it is doing now) the more of a Volume Profile that is carved out . . . . . . . which means a new scenario/range/situation that has to be “worked out” in my opinion
JGBs dumped more this week but the curve flattened with a Fed week looming, more wait and see mode - MOVE still dead as a doorknob
$114.8Kish and $119.5Kish, getting trapped under $119.5Kish not desirable . . . . . . . . clearing $121.6Kish sky’s the limit
Things could flip extremely bullish on Lower Time Frames in a heartbeat as not a ton standing in the way as it levitates inside this Volume Profile
Risk On/Off
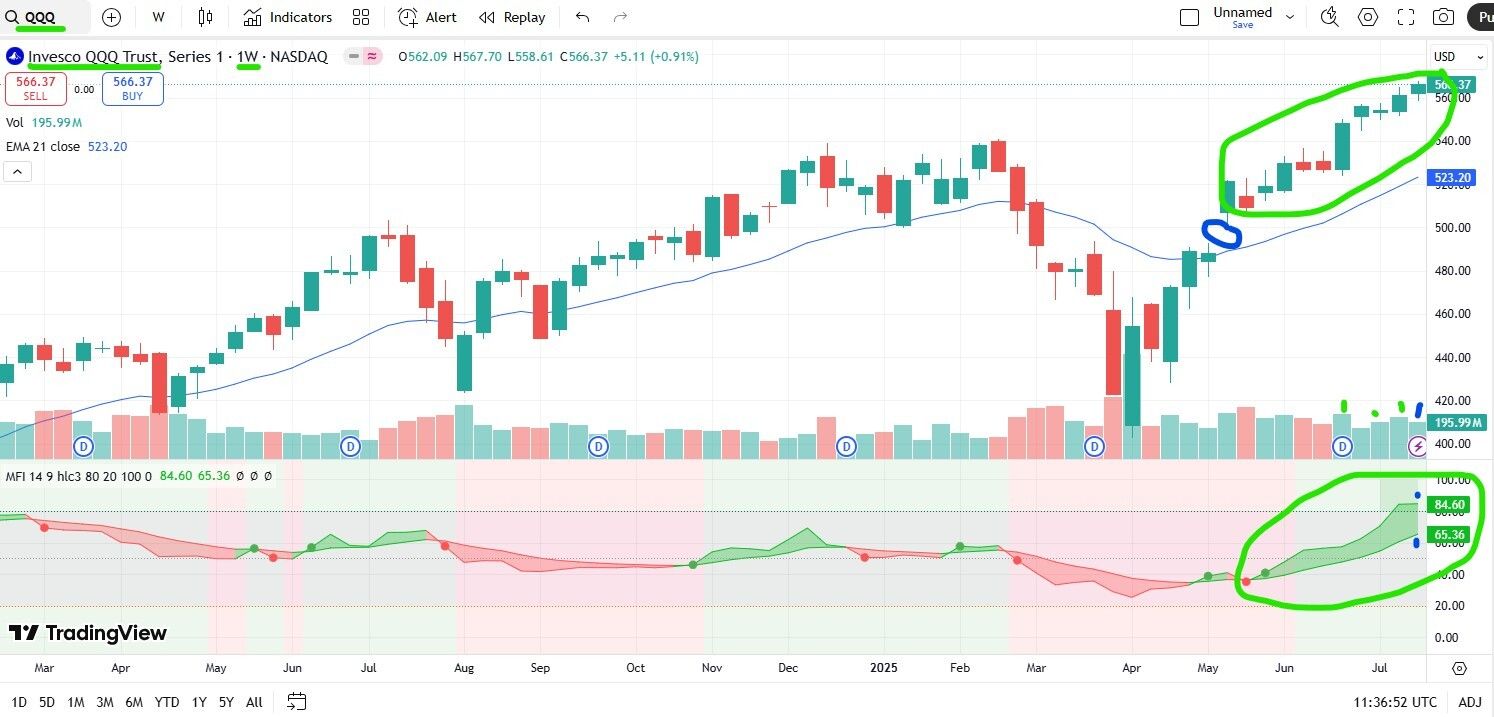
QQQ Weekly below - yeah that huge gap sits there (blue circle) but it still remains bullish. Volume dropped this week but it closed in the upper half of the range. In all fairness, no real, broad warnings as of yet on the surface.
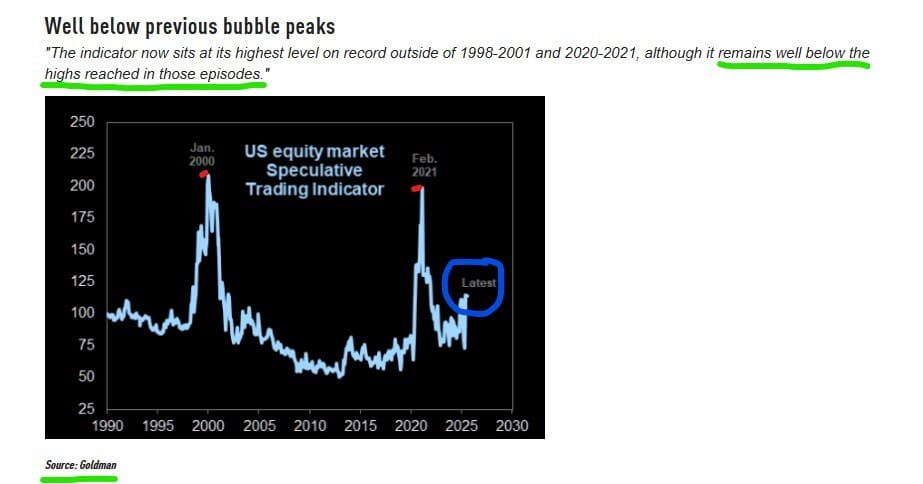
A couple of charts provided by The Market Ear at ZeroHedge.com with some perspective of where we are inside this ‘Melt Up’ relative to some notable prior periods to include the 2020 analogy that topically looks similar:
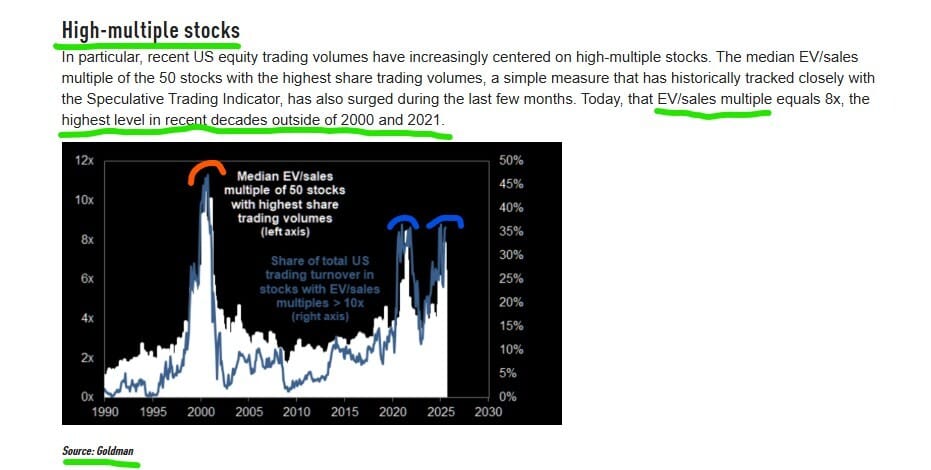
What I find interesting here is the 2021 peak. Many point to charts overlayed showing the bounce from April compared to the bounce from the 2020 lows. I do find that comparison intriguing but at a deeper level. In 2020 and in 2025 there were major shocks to the system that (dare I use this word now) ‘reset’ things. The 2020 shock to the economy was bigger in my view as we literally had business shut down.
However - both periods, in my view, create this kind of slingshot effect where once released the snapback was strong. In terms of EV/Sales (shown above) let’s be honest we are already where we were snapping back in 2021. In terms of overall spec, according to Goldman Sachs we have been frothier in the past.
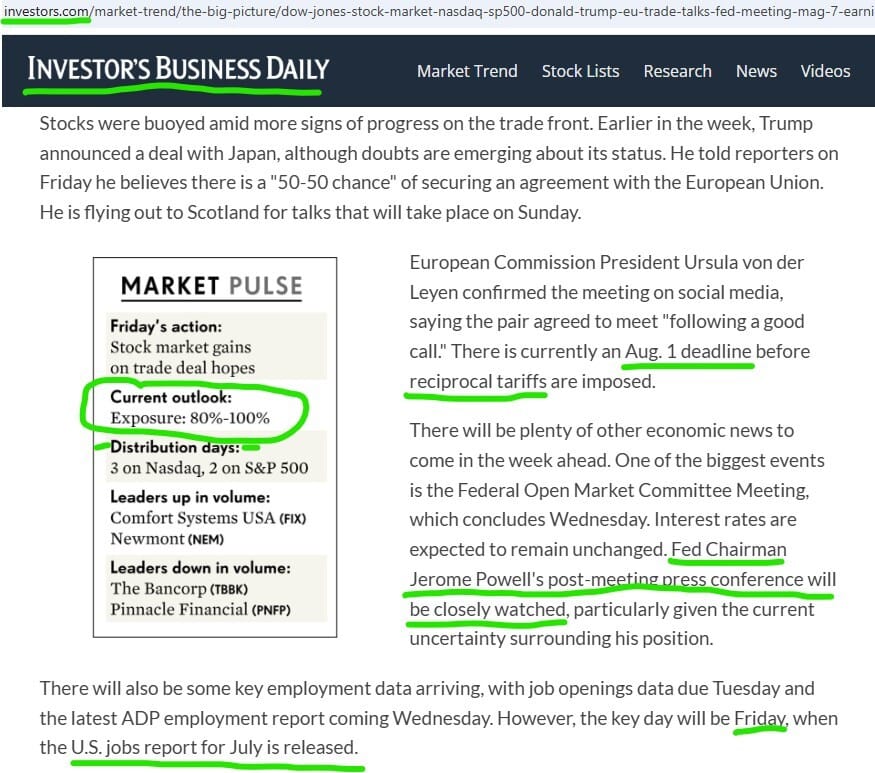
Here is the IBD Big Picture at the end of the week:
Risk On/Off Bottom Line:
Loaded week forthcoming with econ data, earnings, and the Fed
Yields, what moves them lower?????? A collapse in hard econ data AND labor market challenges . . . . . . . . . . . . and it’s intellectually dishonest to claim the labor market has or is weakening materially at this point
What happens when a sumo wrestler sits on one side of a seesaw
A million reasons why we should correct sharply . . . . . . . . . yet here we are . . . . . . . . eyes on the Leading Stocks and Leading Groups . . . . . . . we have seen some modest weakness but not across the board only small pockets so far
A consideration for when we correct . . . . . . . . . the market has already identified some new groups that are emerging as leaders and there are dozens of solid breakouts that leave very strong stocks well above proper buy points . . . . . . . . . . in other words when we correct who’s to say we don’t see a flood of Money Flow waiting for these new leaders to fall back into buy zones only to send us even higher after a correction
Market is running out of good stocks to buy at the right time . . . . . . . . . . it’s as if we either need a correction soon or it goes vertical with even more chasing and exuberance . . . . . . everything is relative and at the margin
Mr. Wong nudges us to See you on the Other Side . . . . . . . but how do we get there with danger lurking?
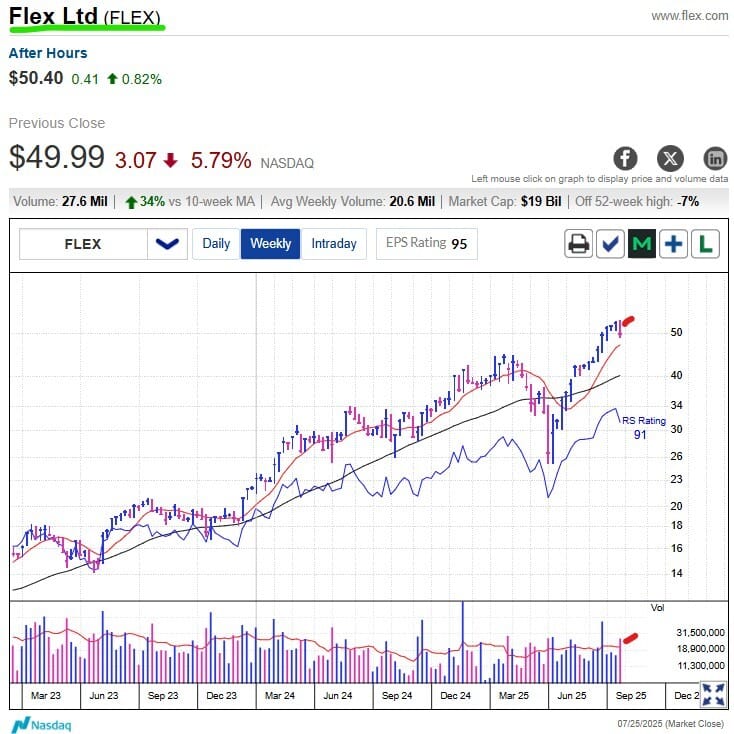
Example of Leading Stock Getting Hit Hard - FLEX
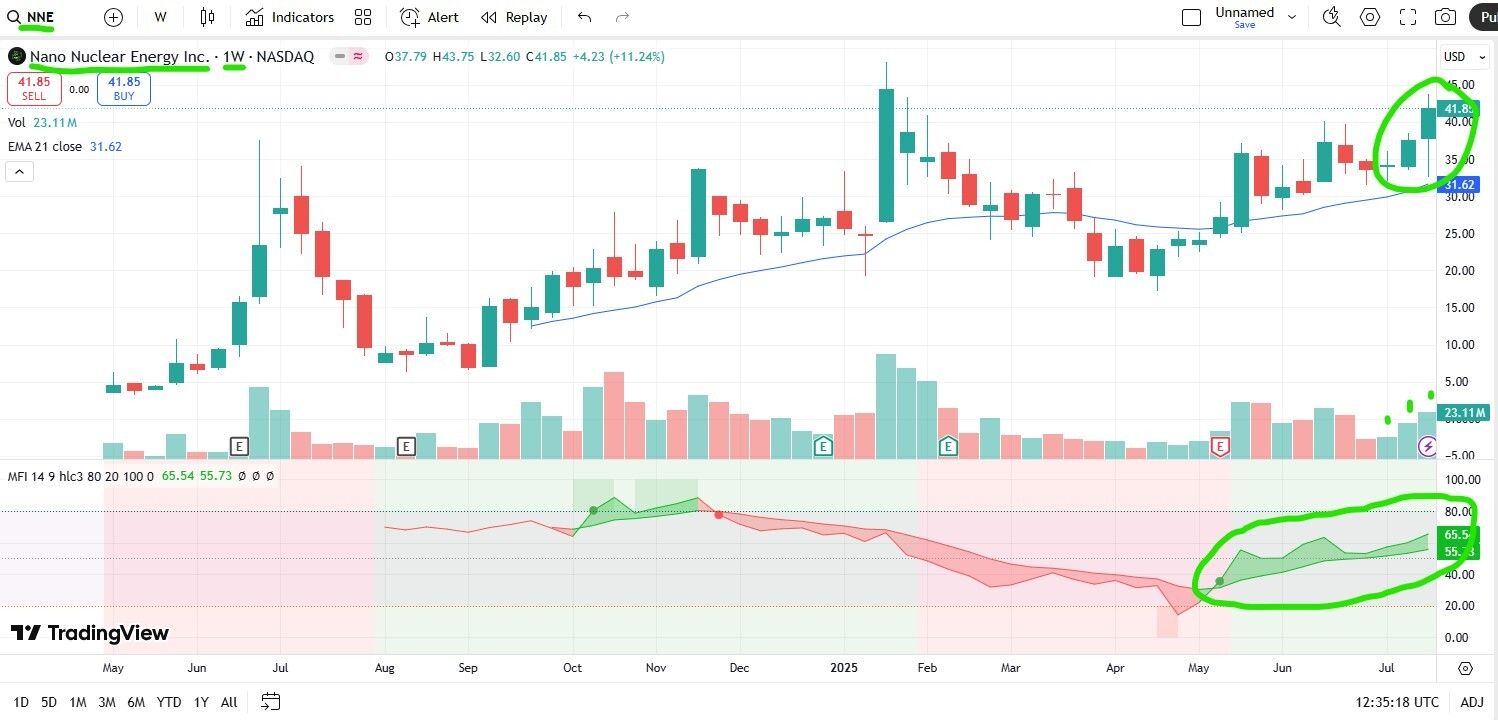
New Potential Target From Mining - Metal Ores Industry Group
I am not long. Have this one under surveillance.
Mining Update
No current straddles, will assess if/when we enter a new zone/range for expansion of Volume Profile and Value Area High/Low (straddle the highs and lows) - candidates are $109.5Kish, $115-$120K, $130-$137K and conversely the $95-$98K zone and $90Kish. My shorts would be bigger and bigger at $95-98Kish and then $90Kish if needed.
$115-$120K as per the above under evaluation - frankly in this zone I haven’t made any moves as of yet directly specifically to BTC, I’m more inclined to deploy a straddle or a net short if a breakdown below $114.8Kish developed in earnest, or a failure to get above $119.5Kish (look at heat map above and overlay with Volume Profile)
holding long USD as hedge/trade
UVIX nibbled on position currently
TBT nibbled on position currently
Subscribe to our brand new YouTube Channel

Matthew Wong
See you on the Other Side